


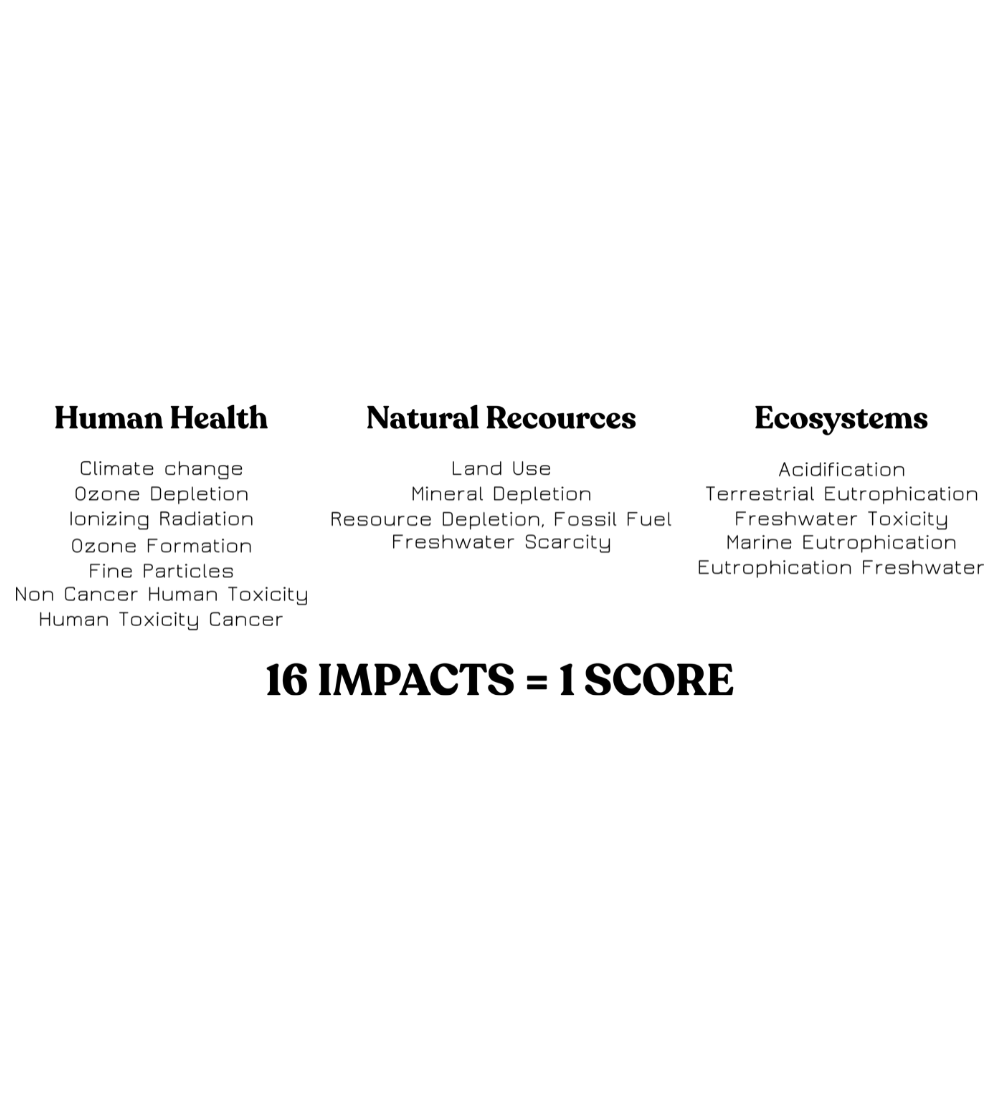
So, what grade do we get?
Now that we have an overview of our 16 impacts, PEF Trust can calculate the Single Score by applying the weighting of each score prescribed by the PEF method. We obtain a micro-point impact score (µpts). It's a bit like getting your math homework back with a 10 but you don't know how much you're getting graded in total. Out of 10 it's very good, out of 20 it's average and out of 100 it's bad.
To be able to obtain the letter to display, we still have to compare our Single Score to that of a reference product comparable in weight. And know how much we are rated on. The exercise consists of doing the same calculation for this reference product in order to obtain a reference Single Score.
It will then suffice to compare the 2 single Scores obtained: that of the Lagoped clothing and that of the reference product
Just a little more effort, we're almost there.
The rating compared to a reference product
There is a reference product per category: t-shirt, ski jacket, pants, etc. These reference products are modeled according to the information described in the Product Environmental Footprint Category Rules (PEFCR) Apparel & Footwear 3.1.
The composition and average weight used for the reference products are not fixed but are likely to evolve depending on the continued evolution of the available data.
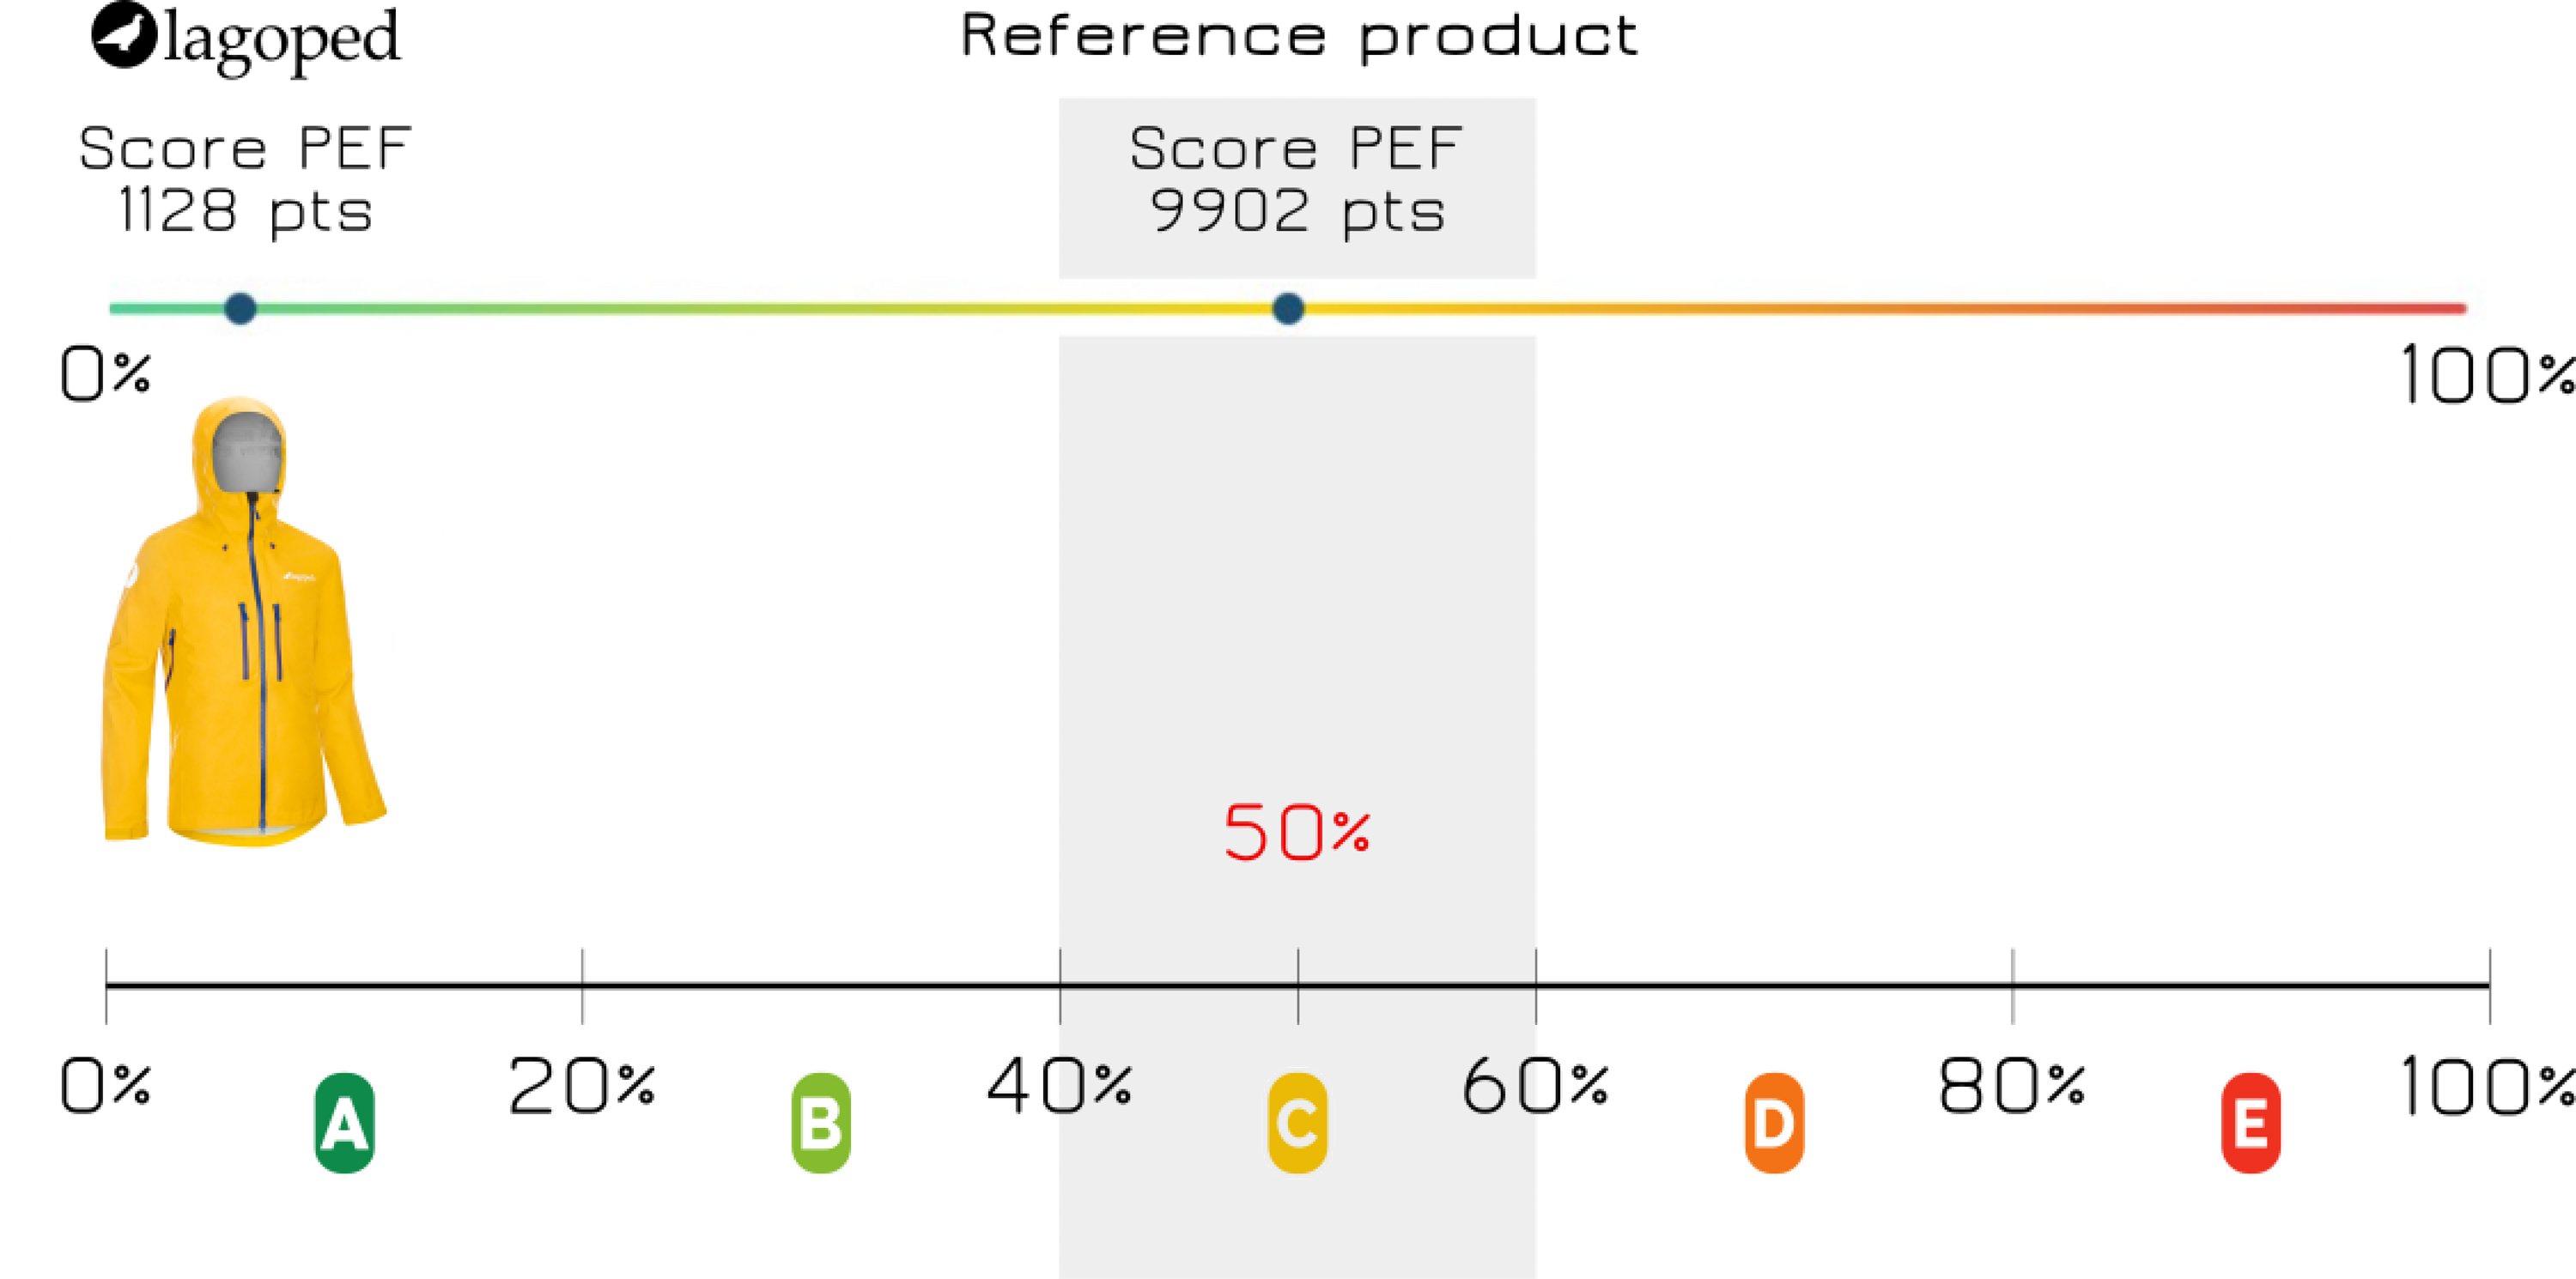
The reference product will itself have a Single Score which, by convention, will correspond to a level of 50% (grade C) on a scale from 0% to 100%. The letters are then distributed based on the single score of the specific product compared to the reference product.
From this scale we use a letter scale of A, B, C, D and E, with A being the best score and E the worst.
The A score is awarded for products with a score between 0 and 20%;
The B score is awarded for products with a score between 20 and 40%;
Etc...